Political scientists have long been outraged over voting waiting times, but a new study has revealed it is not just an inconvenience – it is also a civil rights issue.
By matching the location data from 10 million smartphones to 93,000 polling facilities in the US, researchers found that those in predominately black neighborhoods waited 29 percent longer than those living in primarily white areas.
Smartphone ‘pings’ were collected from within nearly 200 miles of each poling location during the 2016 presidential election and combined with demographic data to determine the racial differences in voting wait times.

By matching the location data from 10 million smartphones to 93,000 polling facilities in the US, researchers found that those in predominately black neighborhoods waited 29 percent longer than those living in primarily white areas
The study was conducted by a team of experts ranging in fields of business, economics and management, who collectively believe ‘equal access to voting is a core feature of democratic government’.
‘Relative to entirely-white neighborhoods, residents of entirely-black neighborhoods waited 29% longer to vote and were 74% more likely to spend more than 30 minutes at their polling place,’ the team shared in the study published in Arxiv.
‘This disparity holds when comparing predominantly white and black polling places within the same states and counties, and survives numerous robustness and placebo tests.’
‘Our results document large racial differences in voting wait times and demonstrates that geospatial data can be an effective tool to both measure and monitor these disparities.’
To get their results, researchers used 93,658 different polling places across the US and converted each location into latitude and longitude coordinates in order to create a map of voting spots using Google Maps API and use Microsoft-OpenStreetmaps, according to Scientific American.
Then smartphone pings were collected from cellphone towers in the area, as this technology determines the owner’s location ‘with reasonable accuracy’.
The team gathered pings that came within nearly 200 feet of a selected polling place during the 2016 US presidential election.

Then smartphone pings were collected from cellphone towers in the area, as this technology determines the owner’s location ‘with reasonable accuracy’. The team gathered pings that came within nearly 200 feet of a selected polling place during the 2016 US election
However, data was combed through to determine who was and was not a voter.
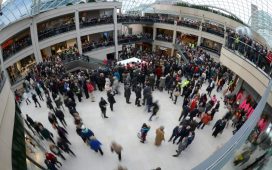
At the end of the collection, there was a sample of more than 150,000 voters at 40,000 polling locations.
In order to determine the race of these neighborhoods, the team looked to demographic data from the US Census.

Relative to entirely-white neighborhoods, residents of entirely-black neighborhoods waited 29% longer to vote and were 74% more likely to spend more than 30 minutes at their polling place
And that is when the team found those in majority-black neighborhoods (as well as other non-white-majority neighborhoods) waited longer.
‘The median and average times spent at polling locations are 14 and 19 minutes, respectively, and 18% of individuals spent more than 30 minutes voting,’ reads the study.
‘Average wait times vary from as low as ∼ 11 minutes in Massachusetts’s sixth congressional district — primarily in Essex County — to as high as ∼ 41 minutes in Missouri’s fifth congressional district, which contains Kansas City.’
Still, the smartphone method does not answer a key question: ‘What it doesn’t tell us is why. What’s going on here?’ Robert Stein, a political scientist at Rice University, who did not participate in the new research, told Scientific America.
‘I would want to use it as a basis for doing further observational studies. You know, you just can’t get that from the phone.’
However, the researchers of the study believe their findings can be used for the greater good.

Smartphone pings were collected from cellphone towers in the area. At the end of the collection, there was a sample of more than 150,000 voters at 40,000 polling locations
‘Exploiting the recent advent of large geospatial datasets, we provide new, nationwide estimates for the wait times of voters during the 2016 US presidential election,’ according to the paper.
‘We find substantial and significant evidence of racial disparities in voter wait times, and detail that geospatial data can robustly estimate these disparities.’
‘This provides policymakers an easily available and repeatable tool to both diagnose and monitor progress towards reducing such disparities.’


