Rishi Sunak is preparing to deliver his set-piece tax and spending update on Wednesday against the backdrop of a deep recession and the threat of a sharp rise in unemployment.
Here are five key charts that will underpin the policymaking behind the chancellor’s announcement.
Furloughed jobs
Unemployment in Britain is beginning to spiral upwards as growing numbers of companies come under financial stress.
The Treasury furlough scheme, which covered 80% of the wages of temporarily laid off staff, has kept a lid on the level of job losses so far. As many as 9.4m jobs have been furloughed at 1.1m firms – more than a quarter of the total UK workforce – at a cost to the public purse of £27.4bn so far. However, the scheme is due to be wound down by the end of October, when unemployment is expected to rise sharply as some struggling firms decline to take furloughed workers back on.
Meanwhile, the number of people claiming unemployment benefits has already risen by 126% since March, hitting 2.8m in May, according to official figures. The Bank of England has warned the UK unemployment rate could more than double to about 9% this summer.
Economic growth
Britain’s economy shrank by a record 20.4% in April after the first full month of the coronavirus lockdown.
The closure of businesses, construction sites falling idle and factories halting production to contain the spread of the disease caused output to collapse at an unprecedented rate. Gross Domestic Product (GDP) fell by 2.2% in the first three months of 2020, the sharpest decline in more than 40 years. A further decline in the second quarter – from April to June – will meet the technical definition of a recession, the first since the financial crisis more than a decade ago.
The Bank of England estimates that GDP could contract by 14% this year, marking the steepest recession for more than 300 years. There are hopes of a more rapid rebound than anticipated, although many economists warn it could take years for the UK to recover.
Government borrowing
The government’s budget deficit – the shortfall between tax income and expenditure – is forecast by the Office for Budget Responsibility to reach about £300bn this year as the economy crashes and spending increases to cushion the blow. It will surpass the deficit incurred after the 2008 financial crisis.
A record £55bn was borrowed in in May alone. This is about the same amount in a single month as planned for the whole year before Covid-19 struck.
Britain’s public debt – the sum total of every annual deficit – has risen to become larger than the size of the country’s economy for the first time since 1963, hitting £1.95tn, or 100.9% of GDP.
Despite the widening deficit, borrowing costs for the government have fallen to record lows, making it cheaper for the state to raise debt. Sunak has therefore been urged not to choke off the recovery by cutting spending too soon.
Housing market
Sunak is considering a stamp duty cut as house prices fall due to lockdown, and as the economic collapse deters buyers and sellers of properties and hampers new home building projects.
House prices in June dropped on an annual basis for the first time since 2012, according to the Nationwide building society, with the average value of a home falling by 0.1%. Compared with May, house prices fell by 1.4% last month, taking the average UK house price to £216,403.
Retail
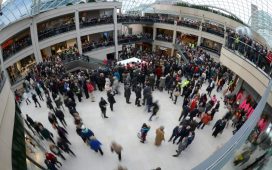
Retail sales plunged by almost a fifth in April as lockdown measures forced non-essential shops to close across the country. With several retailers on the brink of collapse, threatening further store closures on the high street and more job losses, the chancellor is expected to use the summer economic update to announce several financial support schemes.
Retail sales have started to rebound, although remain significantly down on the same time a year ago. Despite the gradual relaxation of lockdown controls over the the past month, footfall in UK town and city centres has remained down by more than half compared with 2019.


