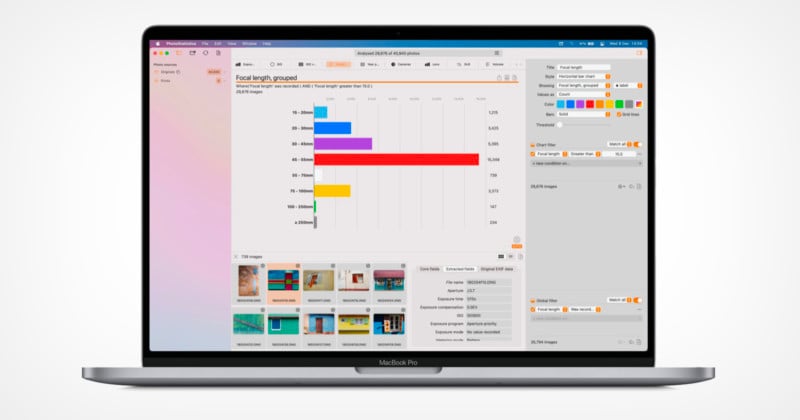
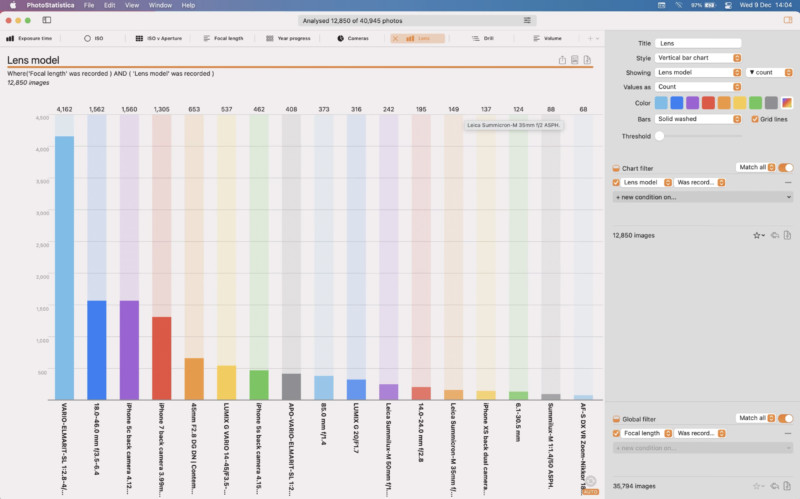
Last June, PetaPixel shared PhotoStatistica, an app that takes the EXIF data from your photos and displays them as graphs. In short, it gave you a visual representation of how you shoot. The app has seen a version 2.0 update that significantly improves its features.
The app’s developer Phil Pegden informed DPReview that the app was updated to version 2.0 and brought with it numerous improvements. Part of those improvements is a BigSur-inspired UI design shift along with support for Apple’s M1 processor.
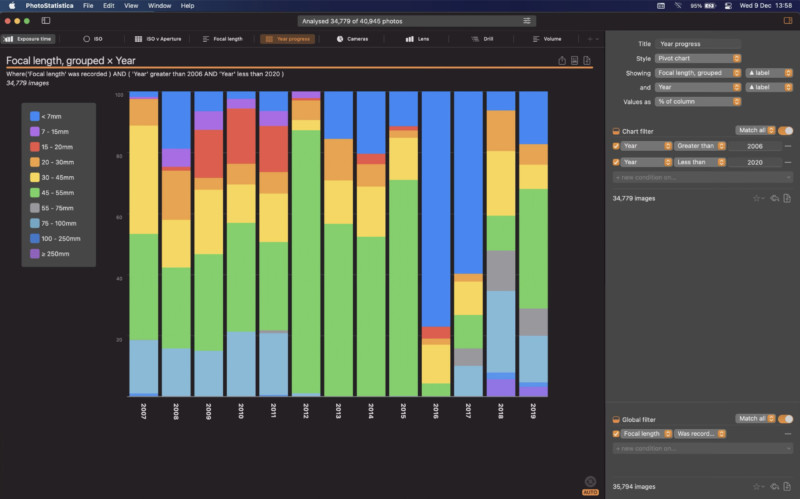
The app promises up to two times faster chart calculation when compared to the previous version, and can handle multiple charts per archive. Additionally, two new chart types were added: pivot charts and drill down, the latter which lets you organize photos by dynamic folders or by EXIF dimensions.
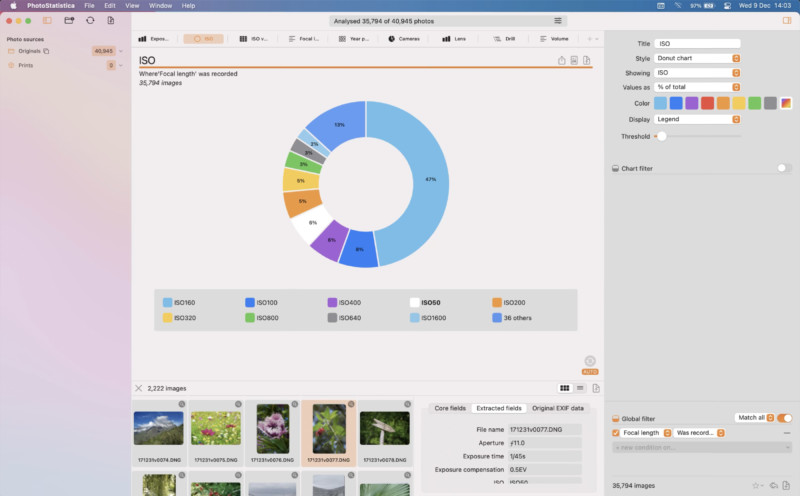
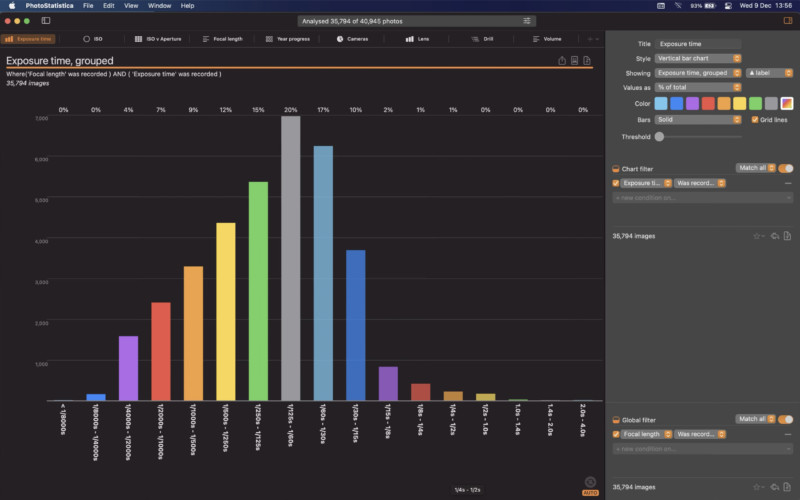
Charts that existed in the previous version also see an upgrade, as bar charts now offer three shading styles, grid lines, and a vertical or horizontal layout. Pie charts can now display labels or a legend and can be drawn in a donut or full pie style.
Pegden also added enhancements to the app’s filters. There is now a global filter that affects all charts, and filters for each chart that will only affect them locally. Filters can also be saved as favorites for easy access, and you can also set filters to auto-apply to data sets.
There are also new export features as well as improved usability enhancements that add further versatility to using the application. You can read the full release notes of all changes here.
PhotoStatistica 2.0 is available for $5.99 on the Mac App Store and is compatible with macOS 11.0 and later.
(via DPReview)


